· deepdives · 7 min read
Unleashing the Power of PerformanceObserver: How to Optimize Your Web App
Learn how to use the PerformanceObserver API to capture real, user-centric performance metrics (LCP, FCP, CLS, FID/INP, long tasks), send them for analysis, set SLOs, and iterate on improvements with code examples, percentile calculations, and real-world optimizations.
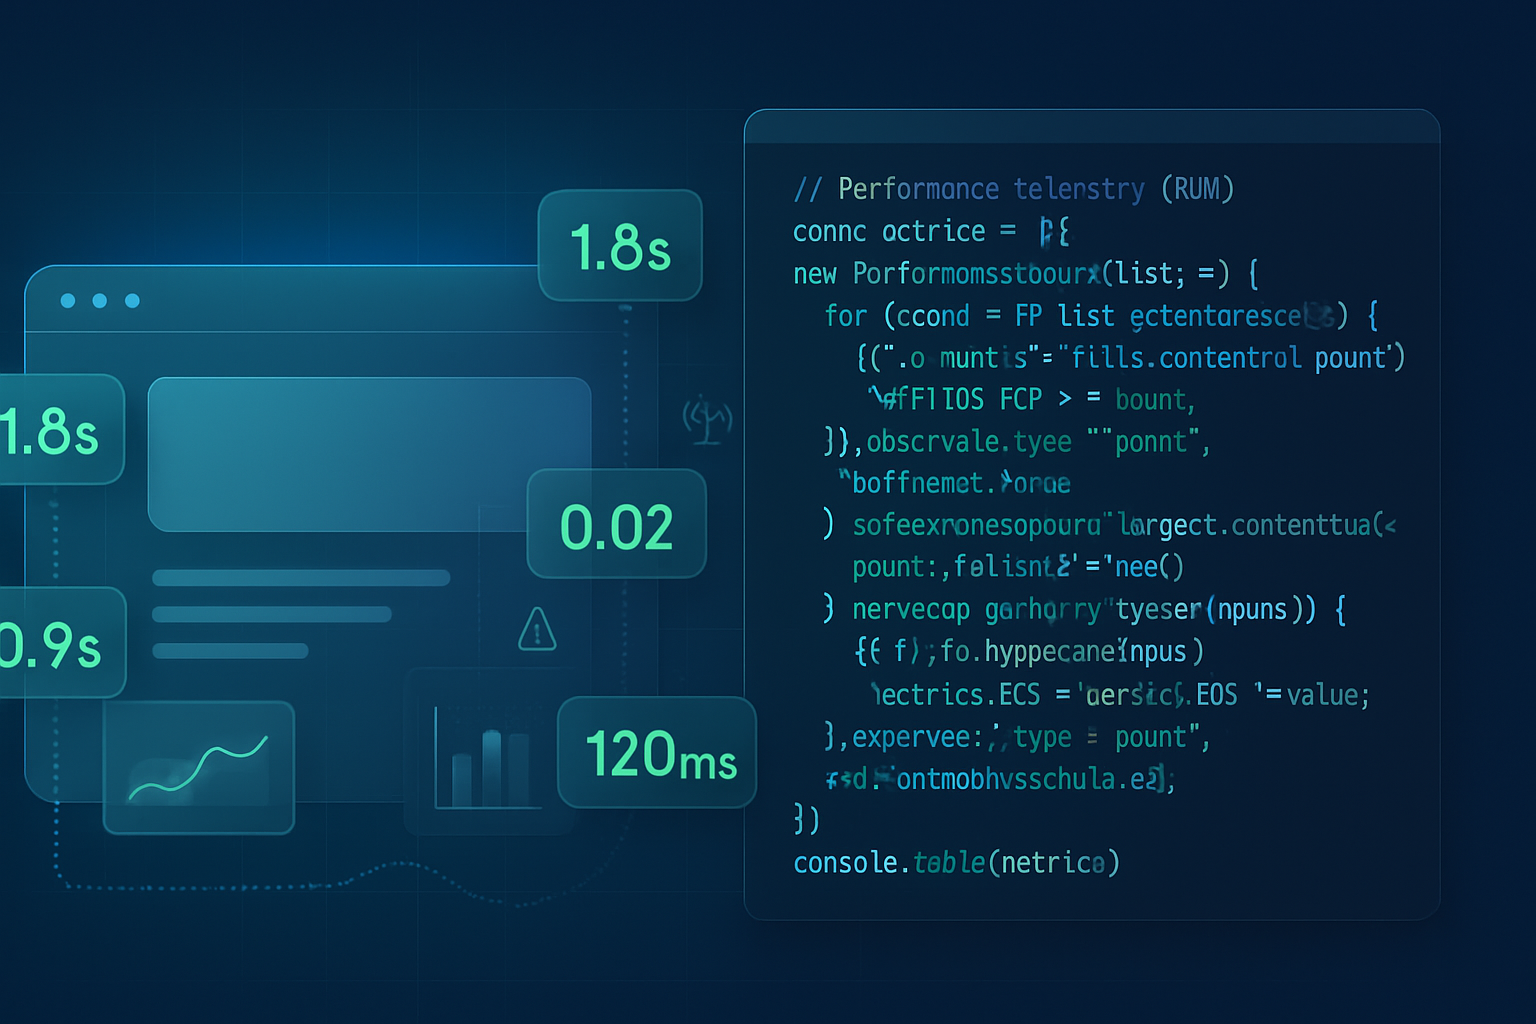
Outcome first: what you’ll be able to do
By the end of this article you’ll be able to instrument your web app with PerformanceObserver, capture user-centric metrics (FCP, LCP, CLS, FID/INP, long tasks), send accurate payloads to your analytics backend, compute meaningful percentiles, and turn the collected data into actionable performance improvements-so users see pages load faster and feel snappier.
Read on for concrete code, prescriptive thresholds, a real-world before-and-after, and practical deployment tips.
Quick primer: why PerformanceObserver matters
Traditional timing APIs gave you page load times measured from the browser window’s perspective. They were useful, but not enough. Modern web performance focuses on how the page feels to users. That’s where the PerformanceObserver API shines: it provides a live stream of high-fidelity, user-centric performance entries (paint, LCP, long tasks, resource timings, layout shifts, and more) that you can observe and react to in real time.
If you want to know what users actually experience-and design fixes that change that experience-PerformanceObserver is one of the best tools in your toolbox.
Useful references:
- MDN: PerformanceObserver
- web.dev: Web Vitals guide
- Chrome docs: PerformanceObserver examples
The basics: set up an observer
This minimal example shows how to observe paint entries for FCP (First Contentful Paint) and capture them for later transmission:
if ('PerformanceObserver' in window) {
  const po = new PerformanceObserver(list => {
    for (const entry of list.getEntries()) {
      // entry.entryType === 'paint' and entry.name === 'first-contentful-paint'
      console.log('FCP:', entry.startTime);
      // Store / send the entry to analytics
    }
  });

  po.observe({ type: 'paint', buffered: true });
}
Notes:
buffered: truelets you observe entries that occurred before the observer was created (important on page load).- Always
disconnect()when you no longer need the observer to avoid memory leaks.
Observing the key user-centric metrics
Below are the common entry types you will want to capture and how to interpret them.
Paint (FCP)
FCP is delivered as a paint entry. It tells you when the browser first rendered any content (text, images, canvas) to the screen.
po.observe({ type: 'paint', buffered: true });
// Look for entry.name === 'first-contentful-paint'
Target: FCP < 1.8s is considered good by web.dev guidelines.
Largest Contentful Paint (LCP)
LCP identifies the render time of the largest image or text block visible within the viewport. Observe largest-contentful-paint like this:
const lcpObserver = new PerformanceObserver(list => {
  const entries = list.getEntries();
  const last = entries[entries.length - 1];
  console.log('LCP candidate:', last.startTime, last.size, last.element);
});

lcpObserver.observe({ type: 'largest-contentful-paint', buffered: true });

// When you know the page is 'final' (user navigated away or interaction ended)
// you can `disconnect()` and send the last LCP value.
Target: LCP < 2.5s is considered good.
First Input Delay (FID) and First Input Processing / INP
FID is measured via the first-input entry type when a user interacts. However, FID only captures the very first interaction; INP (Interaction to Next Paint) is a newer, more comprehensive metric. You can capture first-input like this:
const fidObserver = new PerformanceObserver(list => {
  for (const entry of list.getEntries()) {
    console.log('FID:', entry.processingStart - entry.startTime);
    // entry.duration shows processing time as well
  }
});

fidObserver.observe({ type: 'first-input', buffered: true });
Target: FID < 100ms; INP ideally < 200ms.
Cumulative Layout Shift (CLS)
CLS reports unexpected layout shifts. You can observe layout-shift entries and aggregate them (ignore shifts triggered by recent user input):
let clsValue = 0;
const clsObserver = new PerformanceObserver(list => {
  for (const entry of list.getEntries()) {
    // Only count layout shifts not triggered by user input
    if (!entry.hadRecentInput) {
      clsValue += entry.value;
    }
  }
  // Send or store clsValue periodically
});

clsObserver.observe({ type: 'layout-shift', buffered: true });
Target: CLS < 0.1.
Long Tasks (main-thread blocking)
Long tasks (>50ms) are a powerful signal for jank and poor responsiveness. Observe longtask entries:
const longTasks = [];
const ltObserver = new PerformanceObserver(list => {
  for (const entry of list.getEntries()) {
    longTasks.push({ start: entry.startTime, duration: entry.duration });
    // Consider alerting if entry.duration > 200 (example threshold)
  }
});
ltObserver.observe({ type: 'longtask', buffered: true });
Long tasks help you find expensive scripts, synchronous XHRs, heavy parsing, or expensive layout/paint work.
Resource timing: find slow assets
Resource entries (resource) give you timing for downloads (images, scripts, CSS). Use performance.setResourceTimingBufferSize(n) if you expect many entries.
performance.setResourceTimingBufferSize(300);
const resObserver = new PerformanceObserver(list => {
  for (const r of list.getEntries()) {
    console.log(r.name, r.initiatorType, r.duration);
  }
});
resObserver.observe({ type: 'resource', buffered: true });
Tip: strip or hash URLs in telemetry to protect user privacy and PII.
Collecting, batching, and sending metrics
Don’t send a network request per entry. Batch and send on meaningful events: pagehide, unload (use sendBeacon), or at intervals. Example payload + send pattern:
// Build metrics in memory
const metrics = [];
function enqueueMetric(m) {
  metrics.push(m);
}

// On page hide/send
function flushMetrics() {
  if (!metrics.length) return;
  const payload = JSON.stringify({
    metrics,
    url: stripUrl(location.href),
    ts: Date.now(),
  });

  // Use sendBeacon when possible to avoid blocking unload
  if (navigator.sendBeacon) {
    navigator.sendBeacon('/telemetry/perf', payload);
  } else {
    // Fallback: fetch with keepalive
    fetch('/telemetry/perf', {
      method: 'POST',
      body: payload,
      keepalive: true,
    });
  }
  metrics.length = 0;
}

addEventListener('visibilitychange', () => {
  if (document.visibilityState === 'hidden') flushMetrics();
});

addEventListener('pagehide', flushMetrics);
Server-side: accept the JSON and store timestamps and metric values in a time-series store (e.g., BigQuery, ClickHouse, InfluxDB) or your analytics DB. Keep payloads small-avoid full element HTML or query strings.
Compute percentiles for SLOs
Percentiles are far more informative than averages. Here’s a simple percentile function and example usage to compute the 75th or 95th percentile of LCP values:
function percentile(values, p) {
  if (!values.length) return 0;
  values.sort((a, b) => a - b);
  const idx = Math.ceil((p / 100) * values.length) - 1;
  return values[Math.max(0, Math.min(idx, values.length - 1))];
}

// Example usage:
const lcpValues = [1200, 2300, 800, 2500, 1800];
console.log('75th LCP:', percentile(lcpValues, 75));
Set SLOs against percentiles that matter for your users. Example: 75th percentile LCP < 2.5s and 95th percentile INP < 250ms.
Real-world example: reducing LCP from 4.2s to 1.9s
Scenario: real user telemetry showed 75th percentile LCP = 4.2s. The largest element was a hero image (4MB). Steps and impact:
- Compress hero image to WebP and deliver responsive sizes -> saved 2.1s on median LCP for slow connections.
- Add rel=“preload” for hero image to prioritize fetch -> saved 0.5s.
- Defer non-critical JavaScript and split critical CSS -> improved render times and reduced long tasks.
Result: 75th percentile LCP dropped from 4.2s to ~1.9s. Conversion and engagement improved in subsequent A/B tests.
This demonstrates how telemetry -> hypothesis -> targeted fix -> measurement closes the loop.
Advanced: computing custom metrics from PerformanceEntries
You can create marks/measures and observe them. Example: measure time from hydration start to hobby-specific event:
performance.mark('hydration-start');
// after hydration
performance.mark('hydration-end');
performance.measure('hydration', 'hydration-start', 'hydration-end');

const measureObserver = new PerformanceObserver(list => {
  for (const m of list.getEntriesByType('measure')) {
    console.log('Hydration time:', m.duration);
  }
});
measureObserver.observe({ type: 'measure', buffered: true });
Custom measures are great when you want domain-specific SLOs (time to first meaningful interaction, time to show a product image, etc.).
Practical tips and best practices
- Use
buffered: truefor page-load metrics so you don’t miss early entries. - Always call
disconnect()when the observer is no longer needed. - Batch metrics and use
navigator.sendBeaconorfetchwithkeepaliveon unload. - Sample traffic (e.g., 5–10%) for high-traffic apps to reduce telemetry costs.
- Strip query strings and PII from URLs. Hash or map resource names if needed.
- Use percentile-based SLOs (75th and 95th) rather than averages.
- Monitor long tasks to find root causes of poor responsiveness.
- For single-page apps, be explicit about when a page is “complete”-SPA navigations need manual LCP or other metric lifecycle handling.
Browser support and fallbacks
Most modern browsers implement PerformanceObserver and the common entry types, but support varies for specific entry types and older browsers.
Fallback options:
- Use legacy Navigation Timing (
performance.timing) for basic load times. - Polyfill or sample-only instrumentation for older browsers.
- Where a metric is unsupported, mark it as “unsupported” in telemetry and ensure analysis ignores those samples.
Check MDN compatibility tables for details: PerformanceObserver - MDN.
Security and privacy
- Never send full URLs containing user identifiers, tokens, or PII.
- Respect Do Not Track and user privacy settings if relevant.
- Aggregate and sample data to avoid collecting excessive detail.
Wrap-up and how to move forward
PerformanceObserver gives you the raw, high-resolution signals you need to measure real user experience. Instrument the key entries (paint, LCP, CLS, first-input/INP, longtask, resource), batch and send metrics responsibly, compute percentiles to set SLOs, and close the loop with targeted fixes. Measure, iterate, repeat. The results are faster loads, less jank, and users who stay and convert more often.
