· deepdives · 9 min read
Beyond the Basics: Advanced Techniques for Using PerformanceObserver API
A deep-dive tutorial that shows advanced techniques for using the PerformanceObserver API: feature-detection, buffering, batching and serializing entries, offloading processing to workers, correlating long tasks with frame drops and LCP, production best practices and privacy considerations.
What you’ll be able to do after reading this
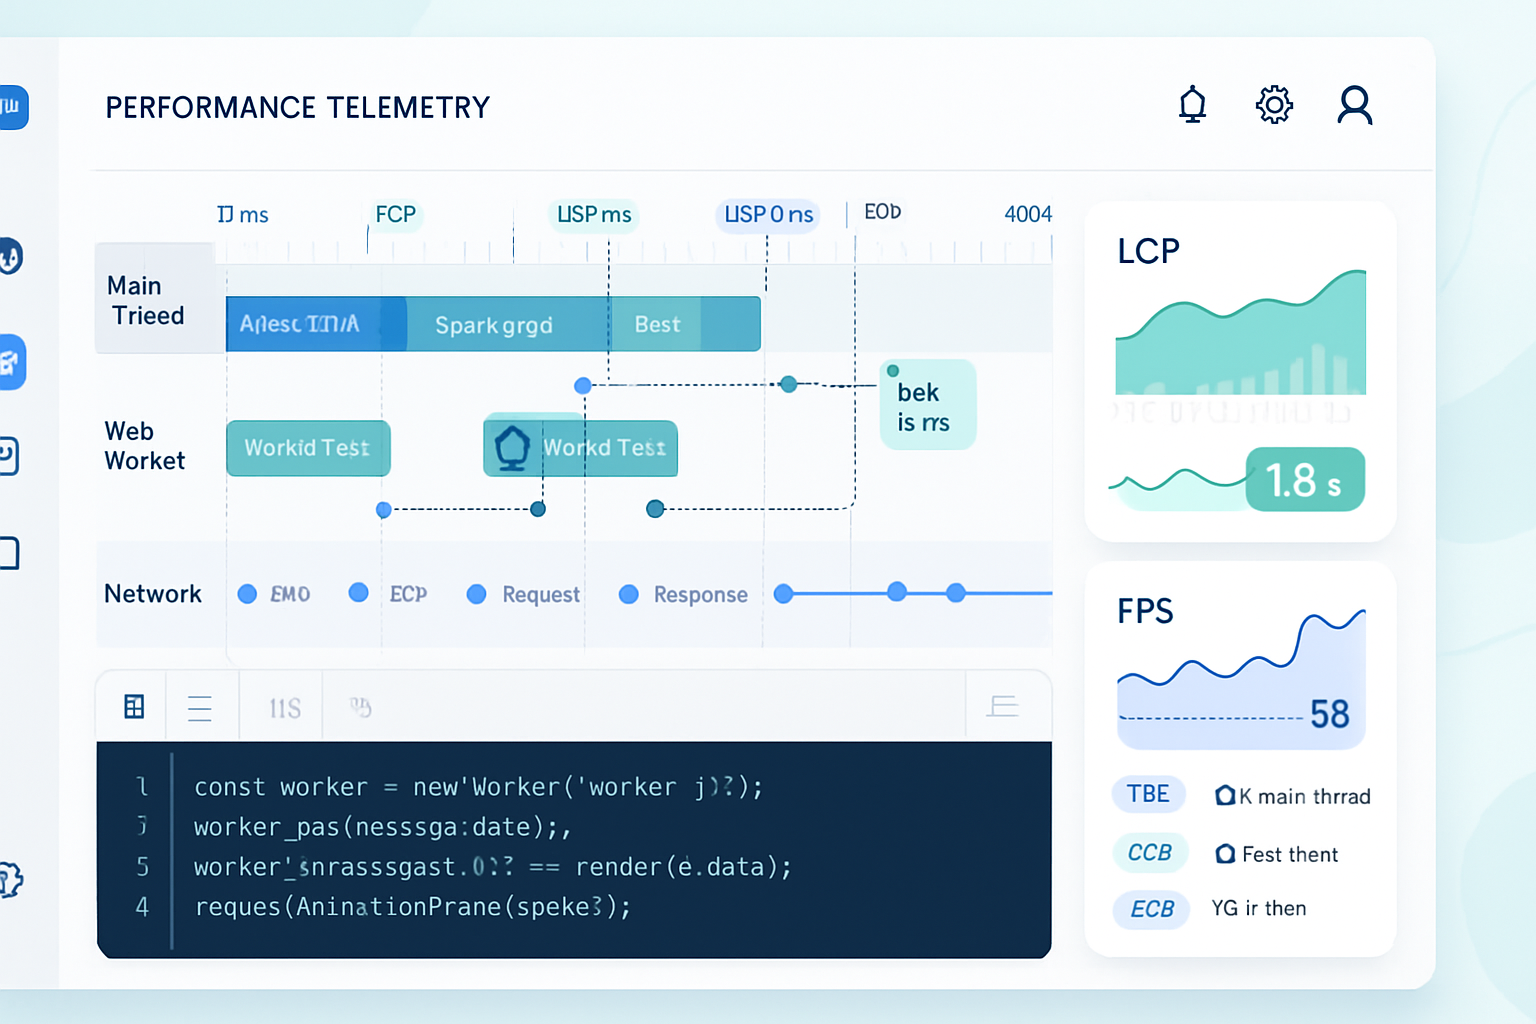
You’ll instrument a production-ready performance-monitoring pipeline that: collects high-fidelity metrics with low overhead, correlates different entry types (Long Tasks, Paints, LCP, Layout Shifts), offloads heavy processing to a worker, and reports reliably to a backend - while respecting browser limits and user privacy. Read on and you’ll move from simple observers to a robust monitoring system that surfaces actionable signals.
Why go beyond the basic observer?
PerformanceObserver is simple to start with. A few lines and you get paint or resource events. But out of the box you’ll hit practical problems: bursty record flows, main-thread cost, cross-browser feature differences, privacy filters and timing limits, and unstructured payloads that are expensive to send. This guide shows how to treat PerformanceObserver as a low-level sensor and build a production-grade monitoring layer on top.
Feature detection and safe setup
Always detect support and the specific entry types you plan to observe. Some browsers may not support newer entry types (for example, largest-contentful-paint, layout-shift, or event).
if (typeof PerformanceObserver === 'undefined') {
  console.warn('PerformanceObserver not supported');
  // fallback to periodic checks with performance.getEntriesByType
}

const supported = PerformanceObserver.supportedEntryTypes || [];
const canObserve = type => supported.includes(type);

// Example guard
if (canObserve('largest-contentful-paint')) {
  // safe to observe LCP
}
Reference: MDN - PerformanceObserver
Use buffered mode to capture early events
If you register the observer after navigation or paint events already occurred, use buffered: true to obtain earlier entries (when supported). This is essential for capturing LCP or first paints in single-page-apps that mount late.
const po = new PerformanceObserver(list => {
  // handle entries
});
po.observe({ type: 'largest-contentful-paint', buffered: true });
Reference: web.dev - PerformanceObserver
TakeRecords, batching and debounce: don’t process on every entry
Observers can deliver bursts of entries. Use takeRecords() to exhaust the internal queue and process a batch. Debounce or schedule processing with requestIdleCallback or a short setTimeout to avoid main-thread spikes.
const buffer = [];
const po = new PerformanceObserver(() => {
  buffer.push(...po.takeRecords());
  // schedule a deferred job instead of processing immediately
  if (!scheduled) {
    scheduled = true;
    requestIdleCallback(
      () => {
        processBatch(buffer.splice(0));
        scheduled = false;
      },
      { timeout: 200 }
    );
  }
});
po.observe({ type: 'longtask', buffered: true });
This pattern reduces per-entry overhead and allows you to send compact batches to a worker or network.
Serialize entries before sending (and why)
PerformanceEntry objects are not guaranteed to be structured-clonable in every environment. Instead, extract the fields you need and send plain objects. That also reduces payload size.
function serialize(entry) {
  const base = {
    entryType: entry.entryType,
    name: entry.name,
    startTime: entry.startTime,
    duration: entry.duration,
  };

  if (entry.entryType === 'longtask') {
    base.attribution = (entry.attribution || []).map(a => ({
      name: a.name,
      startTime: a.startTime,
    }));
  }

  if (entry.entryType === 'layout-shift') {
    base.value = entry.value; // contribution to CLS
    base.sources =
      entry.sources &&
      entry.sources.map(s => ({
        node: s.node ? summarizeNode(s.node) : null,
        previousRect: s.previousRect,
        currentRect: s.currentRect,
      }));
  }

  return base; // plain object, safe to postMessage or sendBeacon
}
Summarize DOM nodes (or omit) to avoid cloning elements and leaking sensitive info.
Offload heavy work to a worker (MessageChannel pattern)
Parsing, correlating and compressing records can be done off the main thread. Send serialized records to a dedicated Worker or a Service Worker via postMessage. Use MessageChannel when you want two-way communication with low latency.
Main thread:
// assume `worker` is a Worker
function postBatchToWorker(entries) {
  const serial = entries.map(serialize);
  worker.postMessage({ type: 'perfBatch', entries: serial });
}
Worker (worker.js):
self.onmessage = event => {
  if (event.data.type === 'perfBatch') {
    // compress, aggregate, and periodically post to backend with fetch/sendBeacon
    aggregate(event.data.entries);
  }
};
Note: If you send directly to a Service Worker, consider using IndexedDB there for reliability across network outages.
Correlate Long Tasks with frame drops and LCP
Long tasks cause jank. Use longtask entries to mark windows of time (startTime → startTime+duration). Use requestAnimationFrame timestamps to derive dropped frames and frame times, or compute approximate FPS by sampling performance.now() inside rAF loops.
Pattern to correlate:
- Observe
longtaskentries. - For each longtask, check whether a paint/LCP or layout-shift entry occurred during the same time window.
- Record the pairing so you can prioritize fixes that both increased LCP and triggered long tasks.
function correlateLongTaskWithLCP(longtaskEntries, lcpEntries) {
  const results = [];
  for (const lt of longtaskEntries) {
    const windowStart = lt.startTime;
    const windowEnd = lt.startTime + lt.duration;
    const hits = lcpEntries.filter(
      lcp => lcp.startTime >= windowStart && lcp.startTime <= windowEnd
    );
    if (hits.length) results.push({ longtask: lt, lcpHits: hits });
  }
  return results;
}
This prioritizes optimizations where heavy scripting blocks coincided with visible regressions.
Measuring frame rate (FPS) and micro-jank
There is no built-in FPS entry type, but you can compute it with rAF timestamps and correlate with longtask entries:
let last = performance.now();
let frames = 0;
let fpsBuckets = [];

function rafTick(t) {
  frames++;
  const dt = t - last;
  if (dt >= 1000) {
    fpsBuckets.push({ time: t, fps: Math.round((frames * 1000) / dt) });
    frames = 0;
    last = t;
  }
  requestAnimationFrame(rafTick);
}
requestAnimationFrame(rafTick);
Then correlate fpsBuckets with longtask windows to attribute spikes to script activity.
Measuring user interaction metrics: Event Timing and first-input
The Event Timing API gives you fine-grained input handling times and processing temperature - an alternative to older FID approaches. Use PerformanceObserver to listen to event entries. For older browsers, instrument pointerdown/pointerup and measure delta to first paint.
if (canObserve('event')) {
  const po = new PerformanceObserver(list => {
    for (const e of list.getEntries()) {
      // e.duration, e.processingStart, e.processingEnd
    }
  });
  po.observe({ type: 'event', buffered: true });
}
Reference: web.dev - Event Timing
LCP and the single-value pattern
Largest Contentful Paint is a single metric you typically capture once (the final LCP). Observe with buffered:true and disconnect once you have a stable value (e.g., after user interaction or page hide). Keep in mind SPA route changes require re-observing.
let lcpValue = null;
if (canObserve('largest-contentful-paint')) {
  const po = new PerformanceObserver(list => {
    for (const entry of list.getEntries()) {
      lcpValue = entry.startTime; // update with the latest candidate
    }
  });
  po.observe({ type: 'largest-contentful-paint', buffered: true });

  // Send final LCP later (for example, on 'visibilitychange' hidden)
  document.addEventListener('visibilitychange', () => {
    if (document.visibilityState === 'hidden' && lcpValue) {
      navigator.sendBeacon('/collect', JSON.stringify({ lcp: lcpValue }));
      po.disconnect();
    }
  });
}
Reference: web.dev - Largest Contentful Paint
Resource Timing considerations and Timing-Allow-Origin
Resource timing entries for cross-origin resources are truncated unless the resource provides the Timing-Allow-Origin header. If you rely on resource timing to find slow third-party resources, instruct your team to set the header or focus on same-origin assets.
if (canObserve('resource')) {
  const po = new PerformanceObserver(list => {
    const entries = list
      .getEntries()
      .map(e => ({
        name: e.name,
        startTime: e.startTime,
        duration: e.duration,
      }));
    // send or aggregate
  });
  po.observe({ type: 'resource', buffered: true });
}
Reference: MDN - Resource Timing API
Buffer size and memory management
Browsers keep internal performance buffers and some will drop old entries if the buffer is full. Use performance.setResourceTimingBufferSize() for resource entries when you expect many resources. Clear entries you don’t need with performance.clearResourceTimings() to free memory.
if (performance.setResourceTimingBufferSize) {
  performance.setResourceTimingBufferSize(200); // default may be lower
}

// Periodically clear if you are retaining processed resource entries
performance.clearResourceTimings();
Privacy, throttling and site policies
- Layout shift and some event data are subject to privacy heuristics; they may be filtered on background tabs or hidden frames.
- Cross-origin resource timing requires
Timing-Allow-Originto get full details. - Avoid collecting raw DOM snapshots. Summaries are safer and smaller.
Design your reporting so raw PII never leaves the client.
Reliable delivery: sendBeacon, Service Workers, and batching
Use navigator.sendBeacon() for visibility-change or unload-time reporting. For richer batches, send via Fetch from a Worker with retry logic and persistent storage (IndexedDB). Example strategy:
- Batch in memory.
- Offload to worker for aggregation.
- Worker writes to IndexedDB if offline and retries periodically.
- On visibility change or pagehide, call sendBeacon for a final flush.
This combination maximizes delivery reliability with minimal main-thread cost.
Example: A compact, production-ready observer pipeline
The snippet below demonstrates a compact pipeline: feature detection, buffered observe, takeRecords batching, serialization, worker offload and final send with sendBeacon.
// main.js
const supported = PerformanceObserver.supportedEntryTypes || [];
const worker = new Worker('/perf-worker.js');
let buff = [];
let scheduled = false;

function serialize(e) {
  return {
    entryType: e.entryType,
    name: e.name,
    startTime: e.startTime,
    duration: e.duration,
    // include specific fields selectively
  };
}

function scheduleFlush() {
  if (scheduled) return;
  scheduled = true;
  requestIdleCallback(
    () => {
      if (buff.length) {
        worker.postMessage({ type: 'perfBatch', entries: buff.map(serialize) });
        buff = [];
      }
      scheduled = false;
    },
    { timeout: 500 }
  );
}

if (supported.length) {
  const po = new PerformanceObserver(() => {
    buff.push(...po.takeRecords());
    scheduleFlush();
  });
  po.observe({ type: 'longtask', buffered: true });
  if (supported.includes('largest-contentful-paint'))
    po.observe({ type: 'largest-contentful-paint', buffered: true });
}

// send a final flush on page hide
addEventListener('visibilitychange', () => {
  if (document.visibilityState === 'hidden') {
    if (buff.length) {
      navigator.sendBeacon('/collect', JSON.stringify(buff.map(serialize)));
    }
  }
});
Worker sketch (perf-worker.js):
self.onmessage = e => {
  if (e.data.type === 'perfBatch') {
    const entries = e.data.entries;
    // aggregate/compress and send to server via fetch
    fetch('/collect', { method: 'POST', body: JSON.stringify({ entries }) });
  }
};
This is intentionally simple; extend it with compression, IndexedDB fallback, and retry logic for robustness.
Cross-browser caveats
- Some entry types are not supported everywhere. Use
PerformanceObserver.supportedEntryTypes. buffered: truemay not be available for all entry types in older browsers.- Timing values differ in origin (they are relative to navigationStart). Use them consistently.
What to measure vs what to ignore
Don’t collect everything. Focus on signals that drive action: LCP regressions, repeated long tasks, spikes in CLS and poor FPS during critical interactions. Collect representative samples for mobile slow networks; sampling reduces overhead.
Further reading and references
- PerformanceObserver and entry types: MDN - PerformanceObserver
- Practical guidance: web.dev - PerformanceObserver
- LCP deep dive: web.dev - Largest Contentful Paint
- Long Tasks API: web.dev - Long Tasks
- Resource Timing: MDN - Resource Timing API
- W3C Performance Timeline: W3C spec - Performance Timeline
Final tips - what separates production systems from toy samples
- Buffer and batch. 2. Serialize only what you need. 3. Offload parsing and heavy computation to workers. 4. Use sendBeacon/Service Worker + IndexedDB for reliability. 5. Respect privacy and timing filters. 6. Sample in production to limit cost. When implemented carefully, PerformanceObserver is not just a debug tool - it’s a robust sensor that powers continuous performance improvement.
Start small. Validate locally. Then scale the sampling and persistence model. The payoff is fewer regressions and faster experiences for real users - measurable and repeatable.
