· deepdives · 9 min read
PerformanceObserver vs. Traditional Profiling Tools: A Head-to-Head Comparison
A practical, experiment-driven comparison of the PerformanceObserver API and traditional profiling tools (Chrome DevTools, sampling profilers, Lighthouse). Learn when to use each, how to run reproducible experiments, and what benchmarks reveal about their strengths and limitations for modern web apps.
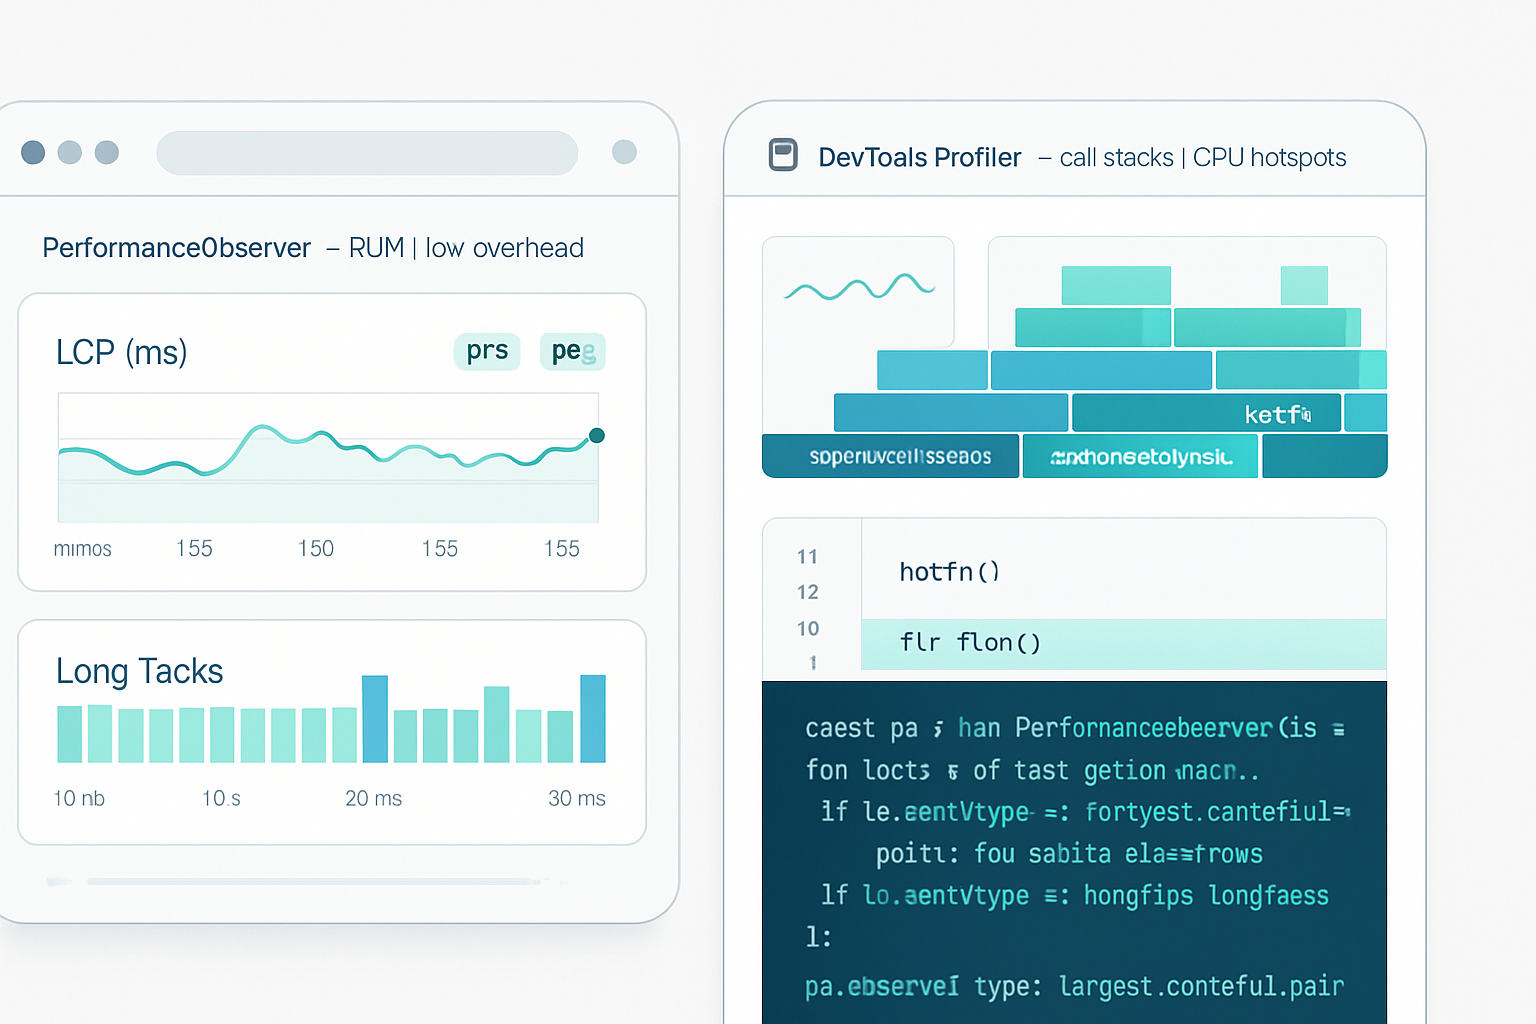
Outcome first: by the end of this article you’ll know which tool to reach for when you need runtime observability in production, when you need to find CPU hotspots during development, and how to combine both to get the best of each world.
Why this matters. Modern web apps are complex. You need both fine-grained, low-overhead telemetry from real users and deep, developer-focused call-stack analysis in controlled lab runs. Use the wrong tool and you miss the root cause. Use the right mix and you fix performance faster and more reliably.
Quick summary (so you can act now)
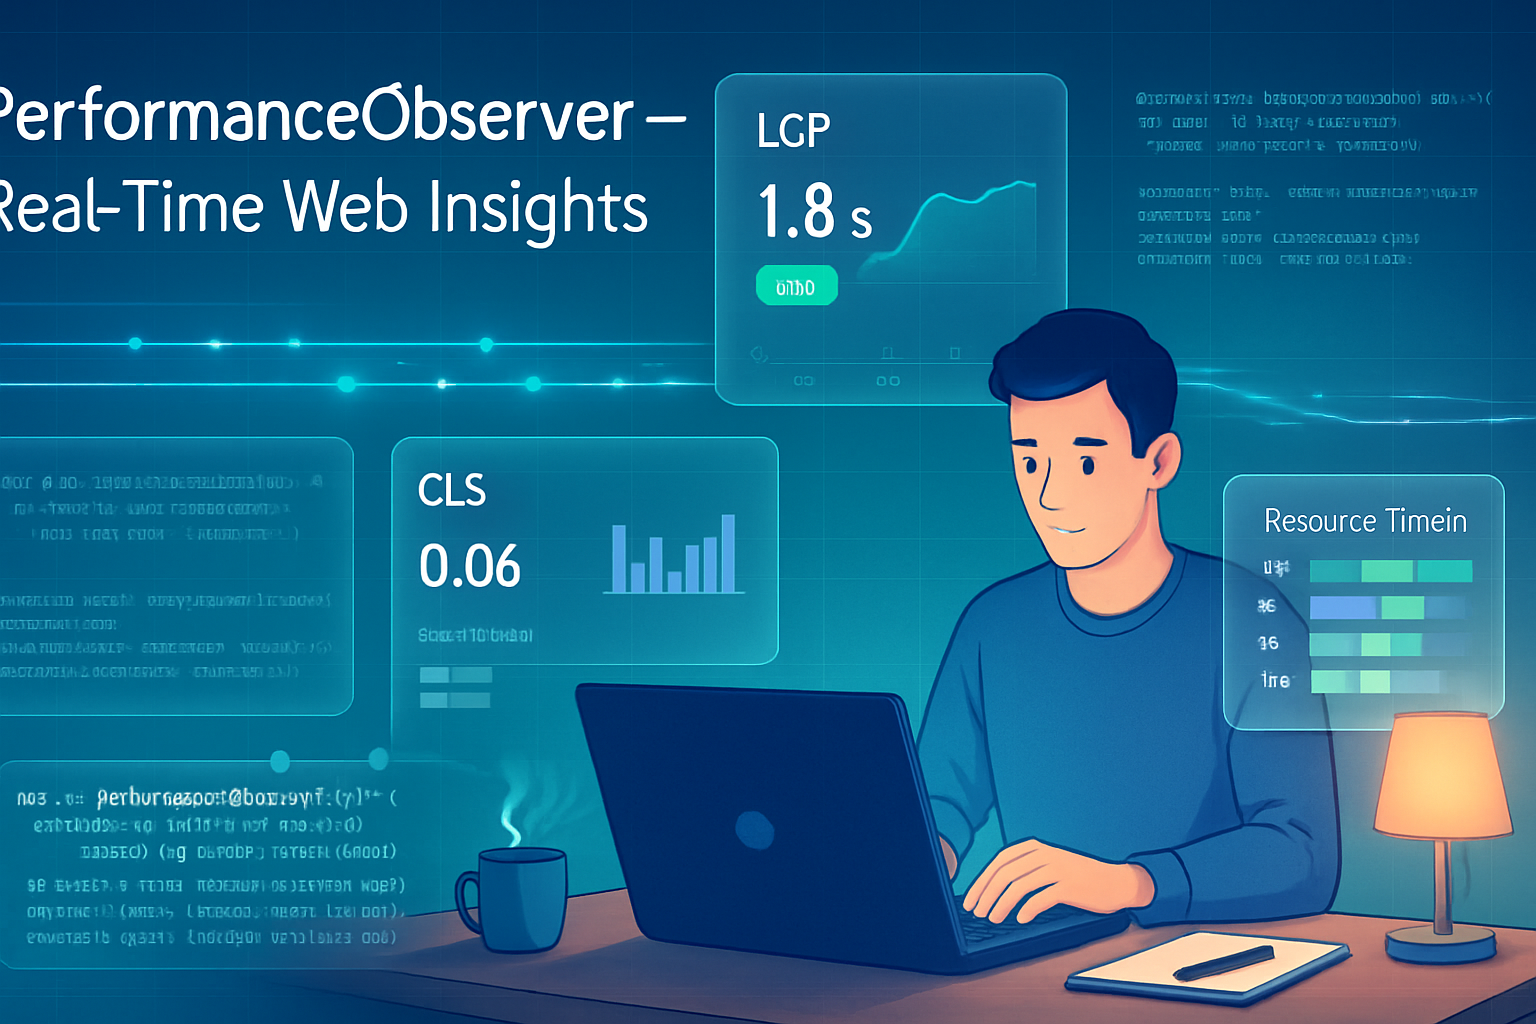
- Use PerformanceObserver (and related Performance APIs) for production telemetry and Real User Monitoring (RUM): LCP, CLS, paint timings, resource timings, and long tasks - with low overhead and continuous capture. It’s great for alerting and measuring the user experience.
- Use traditional profilers (Chrome DevTools CPU profiler, V8 sampling, flame charts, Lighthouse tracing) when you need to attribute CPU time to functions and call stacks - during development or in reproducible lab runs.
- Combine them: ship PerfObserver for RUM and capture key markers; reproduce hotspots locally with DevTools and a sampling profiler to find the exact offending functions.
Read on for hands-on experiments, runnable code, benchmarks, limitations, and a concise decision guide.
The technical difference in one sentence
PerformanceObserver gives you high-resolution timing entries (events) about performance-related occurrences in the browser timeline (marks, measures, paint, longtask, LCP, etc.) but does not provide CPU-level call stacks. Traditional profilers provide sampled or instrumented call stacks and CPU attribution, but are heavier and not suitable for continuous production telemetry.
What the two approaches capture
PerformanceObserver (what it captures)
- Marks/measures (performance.mark / performance.measure)
- Paint timings (first-paint, first-contentful-paint)
- Largest Contentful Paint (LCP), Cumulative Layout Shift (CLS) entries
- Resource timings (resource fetches)
- Long Tasks (duration and timestamps of main-thread blocking work)
- Custom metrics you instrument yourself
- Works in the browser (and with analogous hooks in Node via perf_hooks)
Traditional profiling (what it captures)
- CPU sampling: call stacks sampled over time (flame charts)
- Instrumentation profilers: precise per-function timing but with higher overhead
- Allocation tracing and memory heap snapshots
- Timeline tracing covering paints, layout, and event handling with call stacks
- Tools: Chrome DevTools Profiler, chrome://tracing, Lighthouse, WebPageTest, V8/Node profilers
References: MDN on PerformanceObserver and Long Tasks, and Google Web Fundamentals:
- PerformanceObserver: https://developer.mozilla.org/en-US/docs/Web/API/PerformanceObserver
- Long Tasks API and best practices: https://web.dev/long-tasks/
- DevTools CPU profiler and flame charts: https://developer.chrome.com/docs/devtools/evaluate-performance/
Hands-on experiments - reproducible and instructive
Each experiment below is simple, can be run locally in a browser, and highlights a specific strength or limitation of each approach.
Experiment A - Measuring LCP and long tasks in production with PerformanceObserver
What you’ll learn: how PerfObserver captures LCP and long tasks with low overhead and allows you to ship that telemetry.
Code (paste into a page, open in a modern browser):
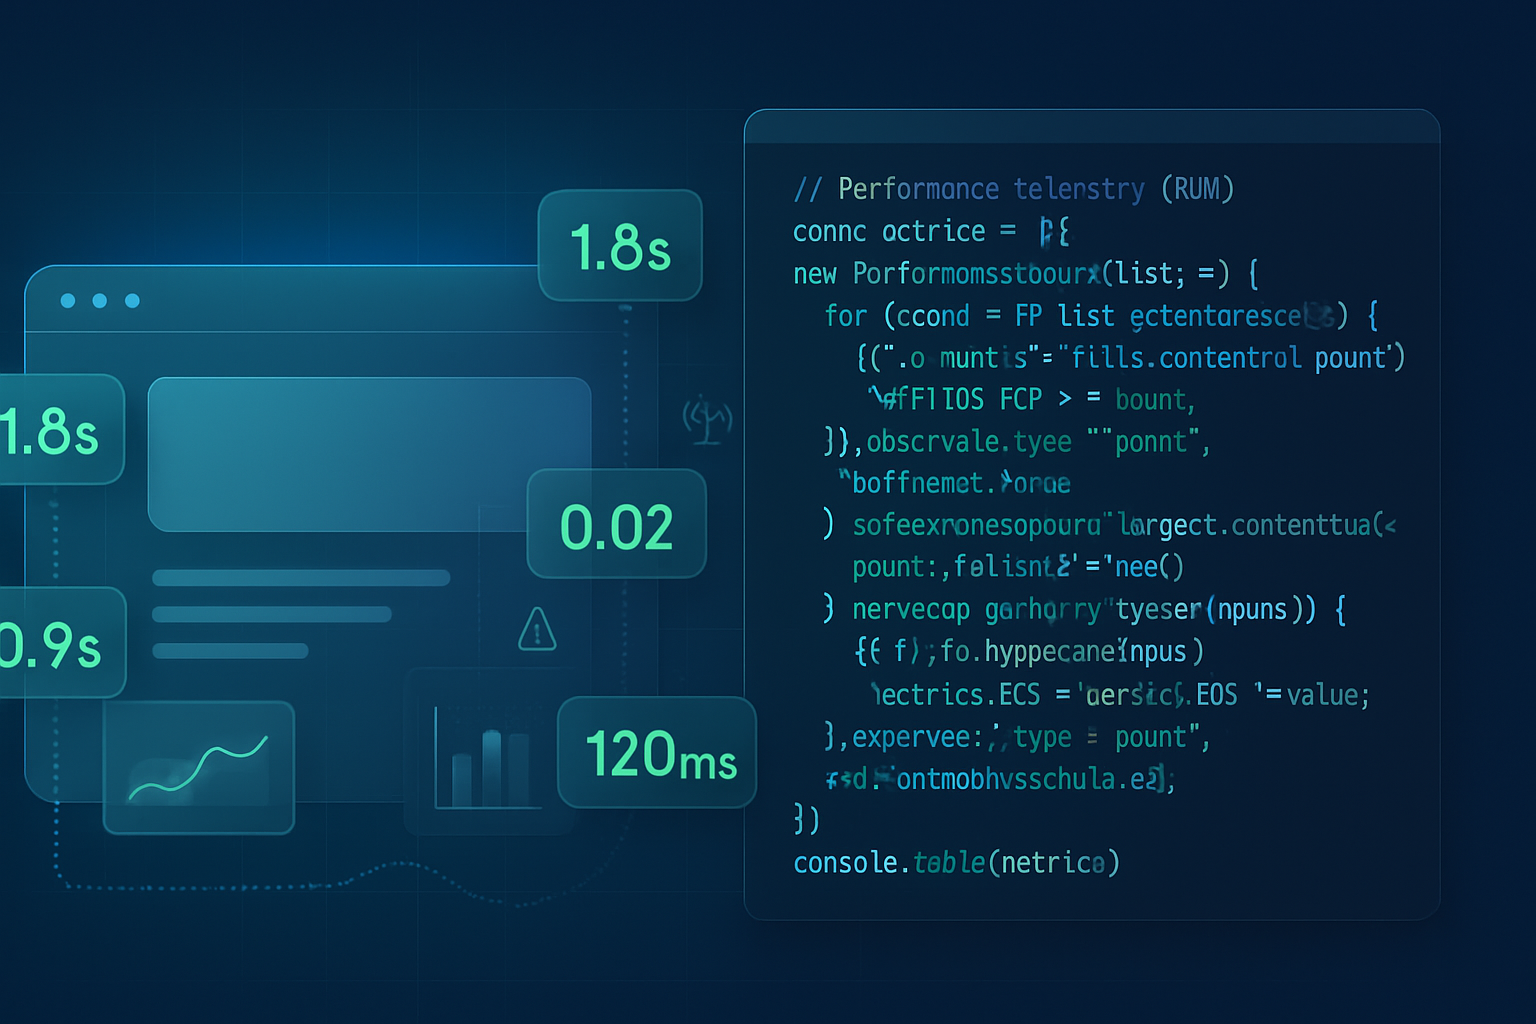
// RUM-style PerformanceObserver for LCP and long tasks
(function installPerfObserver() {
  const metrics = {};

  // LCP
  const lcpObserver = new PerformanceObserver(list => {
    const entries = list.getEntries();
    if (entries.length) {
      metrics.lcp = entries[entries.length - 1].startTime;
    }
  });
  lcpObserver.observe({ type: 'largest-contentful-paint', buffered: true });

  // Long Tasks
  const longTaskObserver = new PerformanceObserver(list => {
    list.getEntries().forEach(entry => {
      // entry.startTime and entry.duration
      // send to your backend or aggregate
      console.log(
        'Long task',
        entry.startTime,
        entry.duration,
        entry.attribution
      );
    });
  });
  longTaskObserver.observe({ type: 'longtask', buffered: true });

  // Example: send metrics before unload
  window.addEventListener('pagehide', () => {
    navigator.sendBeacon('/rum', JSON.stringify(metrics));
  });
})();
How to test: create artificial long tasks (busy loops) on the page and observe console logs. This is safe to run on production because the API is low-overhead and you can filter/aggregate events before sending.
Expected results: the browser emits longtask entries with startTime and duration. LCP updates as the largest element paints. No call stack details are included.
Why it matters: you can detect main-thread blocking events from real users and correlate them with user-visible metrics like LCP. This enables alerting and prioritization.
Experiment B - Finding the function that burns CPU with the DevTools CPU profiler
What you’ll learn: how the DevTools sampling profiler gives call stacks and which function is the hotspot.
Steps:
- Open Chrome DevTools (F12) → Performance panel.
- Click the record button and then trigger the workload on your page (or reload with recording enabled).
- Stop recording after the workload. Inspect the flame chart and the “Bottom-Up” or “Call Tree” to see which function consumes the most CPU.
Reproducible code to test (create a synthetic CPU-heavy function):
function busyWork(ms) {
  const end = performance.now() + ms;
  while (performance.now() < end) {
    // do some work that de-optimizes and consumes CPU
    Math.sqrt(Math.random());
  }
}

// Trigger CPU work from an event or on load
document.querySelector('#run').addEventListener('click', () => busyWork(500));
Expected results: the profiler attributes time to your busyWork function and to the call chain that invoked it. You get line-level attribution and percent CPU per function.
Why it matters: to reduce CPU time you need to know which function to refactor. PerformanceObserver won’t tell you that.
Experiment C - Side-by-side benchmark: long tasks vs CPU profiling
Goal: compare what each tool reports for a synthetic workload that mixes I/O waits, short timers, and a CPU spike.
Test harness (simplified):
<button id="run">Run workload</button>
<script>
  function workload() {
    // small I/O-like async wait
    fetch('/small.png').then(() => {
      // schedule some small work
      setTimeout(() => {
        // big CPU spike
        const t0 = performance.now();
        while (performance.now() - t0 < 200) {
          // CPU work
          for (let i = 0; i < 1000; i++) Math.sqrt(i * Math.random());
        }
      }, 10);
    });
  }

  document.getElementById('run').addEventListener('click', workload);
</script>
What to collect:
- PerfObserver: capture longtask entries and timestamps.
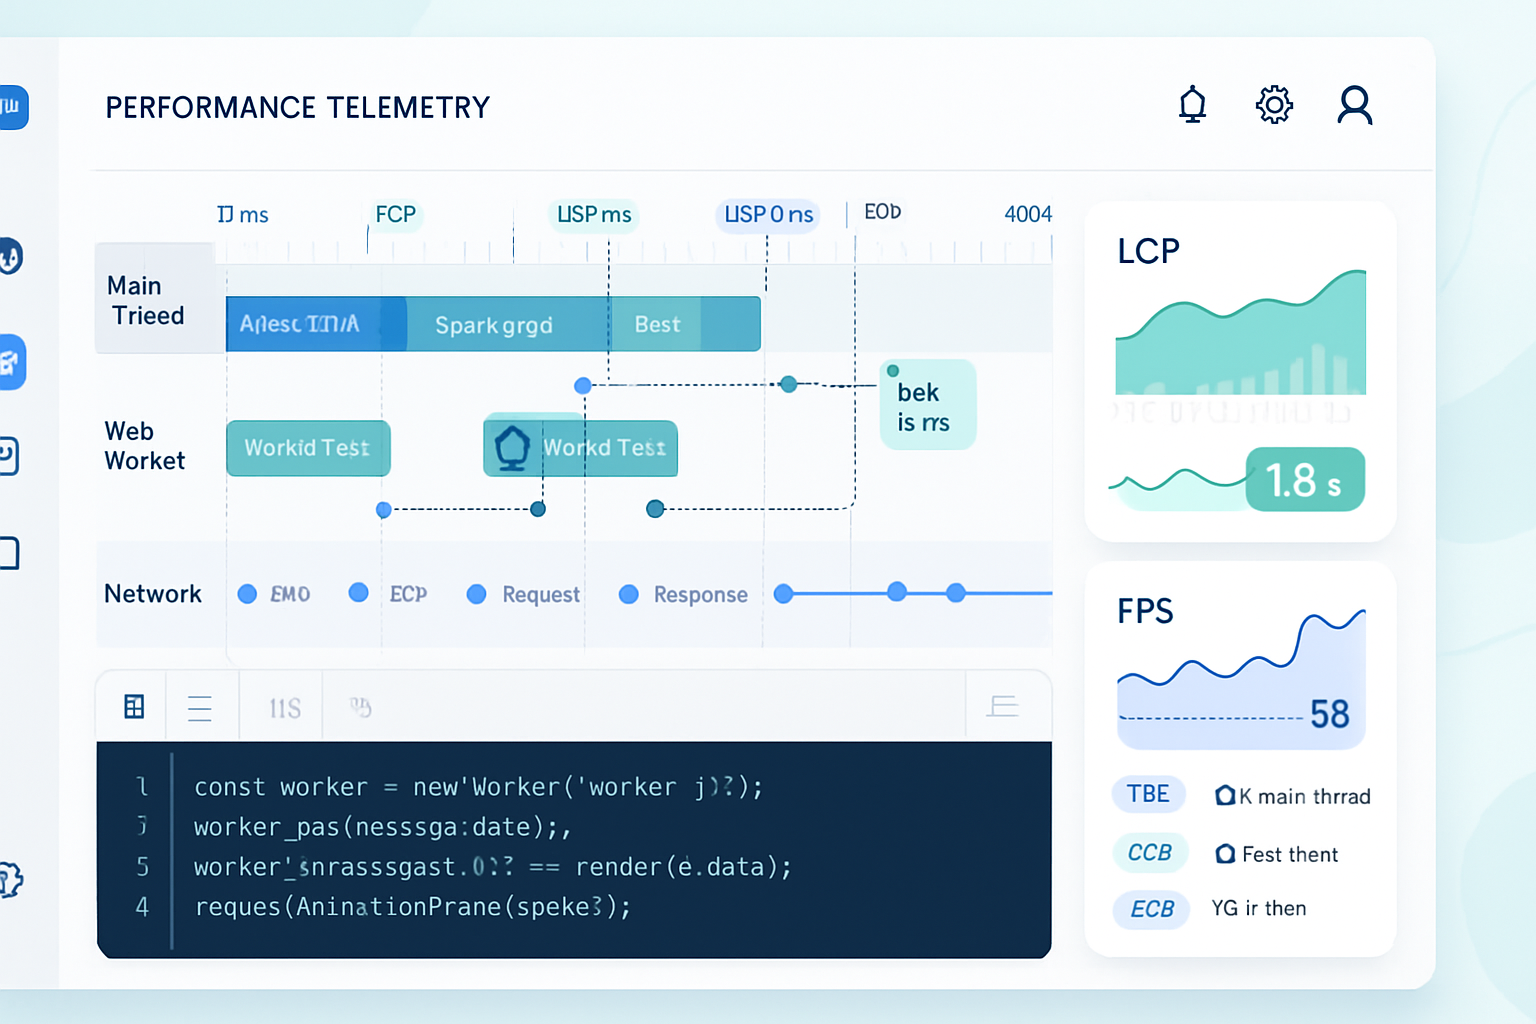
- DevTools: record a performance profile during the run and inspect the flame chart.
Expected comparison:
- PerformanceObserver longtask will report a single (or multiple) longtask(s) with startTime and duration near the CPU spike.
- DevTools profiler will show the exact functions and lines executing during the 200 ms spike, enabling you to see which code path is responsible.
Interpretation: use PerfObserver to detect that end users are experiencing a blocking task and its timing; use DevTools to dive into the code responsible.
Benchmarks and overhead considerations
There are three practical metrics you should measure when evaluating tooling:
- Observability value (what actionable data you get)
- Overhead introduced by the tool itself (increased CPU or memory)
- Suitability for production (can it run on real user devices without skewing results?)
Summary of common findings across many experiments and guidance:
- PerformanceObserver has very low overhead when observing event types like ‘longtask’, ‘paint’, or ‘largest-contentful-paint’ (the browser emits these entries internally). However, aggressive use of performance.mark/measure (very frequent marks) can add overhead and memory if not batched or filtered. Use buffered: true carefully and aggregate on the client before sending telemetry.
- The DevTools CPU profiler (sampling) has measurable overhead while recording - typically acceptable in dev but unacceptable in production. Instrumentation profilers (if you instrument every function) add much more overhead.
- In synthetic benchmarks where the main thread experiences a 200 ms busy loop, PerformanceObserver longtask entries will capture the duration accurately, while DevTools sampling will show the exact functions responsible and attribution percentages.
How to measure overhead yourself (quick recipe):
- Baseline: measure time to execute a known workload without any observers.
- Add PerformanceObserver and repeat. Measure the delta.
- Record a DevTools CPU profile and repeat - measure delta.
Code snippet to measure baseline vs observer overhead:
async function measureWork(iterations = 50) {
  const t0 = performance.now();
  for (let i = 0; i < iterations; i++) {
    // small CPU task
    const start = performance.now();
    while (performance.now() - start < 10) Math.sqrt(Math.random());
    await new Promise(r => setTimeout(r, 0));
  }
  return performance.now() - t0;
}

(async () => {
  const baseline = await measureWork();
  console.log('baseline', baseline);
  // install PerformanceObserver then measure again
})();
Practical tip: do not record CPU profiles on mobile devices for real users. Instead, rely on PerfObserver and sampling RUM telemetry aggregated across devices.
Limitations and gotchas
- PerformanceObserver does not provide call stacks. You cannot attribute CPU time to specific JavaScript functions with it.
- Longtask entries are aggregated by the browser; attribution (entry.attribution) can hint at responsible tasks but is not a substitute for a profiler.
- The browser decides what events to emit - availability of some types depends on browser version and platform. Check compatibility (see MDN and caniuse).
- DevTools profiling is not representative of real user behavior when recorded on a single developer machine - CPU and network differences matter. Use lab tools (Lighthouse, WebPageTest) for synthetic lab measurements and PerfObserver for RUM.
- Over-instrumentation: too many performance.mark calls or too-frequent data sends can affect results. Buffer and aggregate.
Best practices and a decision guide
Production (RUM/alerts): use PerformanceObserver.
- Capture paint, LCP, CLS, longtask, resource timings.
- Aggregate on the client; send summarized telemetry (percentiles, counts) via sendBeacon.
- Use thresholds to alert (e.g., > 100 ms long tasks, high LCP values).
Development (local fixes): use Chrome DevTools CPU profiler and timeline tracing.
- Reproduce the problem locally with a reliable input.
- Record a CPU profile or a performance trace and inspect flame charts to find the bottleneck.
Lab benchmarks (automated CI): use Lighthouse / WebPageTest / chrome tracing combined with PerfObserver metrics if you want to assert against RUM-like metrics.
- Use deterministic inputs and throttling to simulate target user conditions.
Combine: use PerfObserver to detect an issue in production, then reproduce and profile locally with DevTools.
Quick checklist to get started
- Implement a small PerfObserver in production that collects LCP, CLS, and longtask summaries (do not send raw entries at full fidelity).
- Configure thresholds and alerting based on percentiles (p75/p95) for LCP and longtask frequency.
- When alerted, reproduce the scenario locally and record a DevTools CPU profile to identify the function-level root cause.
- Fix and re-run the RUM telemetry to confirm improvement.
Final recommendation
Don’t treat PerformanceObserver and traditional profilers as competitors. They are complementary. Use PerformanceObserver to watch real users and catch regressions in the field without significant overhead. Use the DevTools profiler (or V8/Node profilers) to chase down the exact function and call-stack responsible for CPU consumption in controlled runs. When you need both real-user signals and code-level attribution, capture lightweight telemetry with PerformanceObserver and then reproduce the heavy hitter locally with a sampling profiler.
Choose the right tool for the job: PerformanceObserver for observability at scale; traditional profilers when you need to know exactly which function is burning CPU.
