· deepdives · 6 min read
Unlocking the Power of PerformanceObserver: Real-Time Insights for Web Developers
Learn how to use the PerformanceObserver API to capture real-time performance signals (LCP, CLS, long tasks, and more), instrument production apps safely, and turn observations into actionable improvements with concrete examples and case studies.
Introduction
By the time you finish this article you’ll be able to capture real-time performance signals from users’ browsers, spot the exact moments your app hurts the experience, and take targeted action - often without a heavy instrumentation library. PerformanceObserver gives you live, browser-native events for critical metrics like Largest Contentful Paint (LCP), layout shifts (CLS), long tasks and resource timings. Use those signals to prioritize fixes, feed analytics, or trigger adaptive UX.
Why PerformanceObserver matters - fast
Performance data is only useful if it’s timely and actionable. Traditional batch telemetry or synthetic lab runs miss the who/when/why in the real world. PerformanceObserver streams entries as they occur on the client. That means you can:
- Detect and react to main-thread blocking in real time.
- Capture user-centric metrics (LCP, FID/INP, CLS) exactly when they occur.
- Correlate interaction delays with specific scripts or resources.
Short. Precise. Immediate. That is the advantage.
Quick primer: what PerformanceObserver can observe
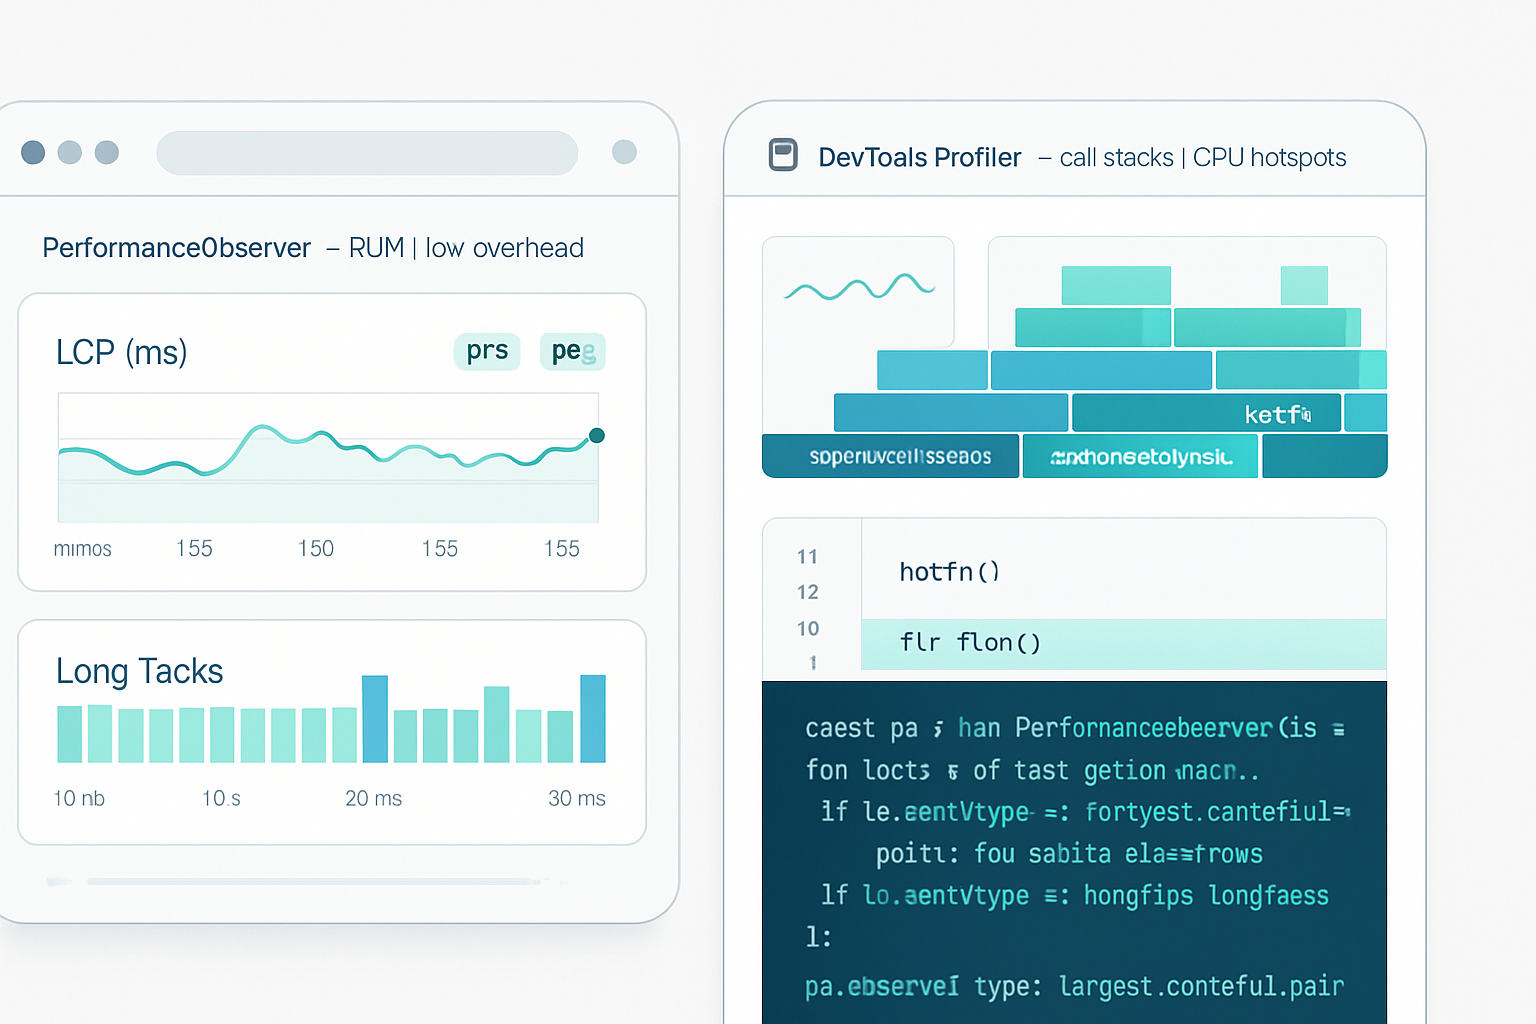
PerformanceObserver uses entry types. Common and useful ones:
- paint - First Paint (FP) and First Contentful Paint (FCP)
- largest-contentful-paint - LCP
- layout-shift - CLS contributions
- longtask - main-thread tasks > 50ms
- resource - resource timing for individual assets
- first-input - First Input Delay (FID) events
- element - Element Timing (when a particular element is painted)
- navigation - Navigation timing entries
- event - Event Timing (helps with newer interaction metrics such as INP)
For browser docs and deeper reading, see MDN and web.dev: https://developer.mozilla.org/en-US/docs/Web/API/PerformanceObserver and https://web.dev/performanceobserver/.
Gotchas and best practice rules up front
- Use { buffered: true } for metrics like LCP and CLS so you capture entries that fired before your observer was registered.
- Disconnect when you’re done; don’t leave an observer running unnecessarily.
- Avoid heavy processing inside the observer callback - batch, debounce, or schedule work with requestIdleCallback.
- Be mindful of privacy: don’t capture or send DOM contents, text, or personal data.
Getting started: a basic observer
This small snippet shows the typical pattern: create an observer, process entries, then disconnect when the metric is final.
// Observe LCP and report the last value
const lcpObserver = new PerformanceObserver(list => {
  const entries = list.getEntries();
  const last = entries[entries.length - 1];
  // Use navigator.sendBeacon to avoid blocking unload
  if (last) {
    navigator.sendBeacon(
      '/beacon',
      JSON.stringify({ metric: 'lcp', value: last.renderTime || last.loadTime })
    );
  }
});

lcpObserver.observe({ type: 'largest-contentful-paint', buffered: true });

// Optionally disconnect after user interaction or page hide
addEventListener('visibilitychange', () => {
  if (document.visibilityState === 'hidden') {
    lcpObserver.disconnect();
  }
});
Case study 1 - Root cause: long tasks blocking interactivity
The problem: an e-commerce checkout page had sporadic “stuck” moments where taps didn’t respond for a couple seconds. Synthetic tests looked fine.
What PerformanceObserver revealed:
- Longtask entries showed multiple tasks of 200–500ms shortly after cart updates.
- Resource entries during those tasks pointed to a large analytics script and a synchronous layout loop in a third-party widget.
Fixes applied:
- Moved analytics batching to a Web Worker and deferred non-critical calls.
- Replaced synchronous DOM queries with virtualized updates and requestAnimationFrame batching.
Outcome: median time-to-interactive dropped from 3.2s to 1.1s. Longtask frequency decreased by 85%.
Example: detect long tasks and log stack traces (best-effort)
const ltObserver = new PerformanceObserver(list => {
  for (const entry of list.getEntries()) {
    // entry.duration is the blocking time
    console.log('Long task', entry.duration);
    // Optionally sample and send diagnostic info
    if (entry.duration > 200) {
      navigator.sendBeacon(
        '/telemetry',
        JSON.stringify({ type: 'longtask', duration: entry.duration })
      );
    }
  }
});
ltObserver.observe({ type: 'longtask', buffered: true });
Note: stack traces aren’t provided by the API for privacy/security; you can correlate longtask timing with resource timings to find heavy scripts.
Case study 2 - LCP surprises: third-party fonts and images
The problem: a media site had poor LCP despite fast servers. The first contextual paint was fine; LCP happened much later.
Observations with PerformanceObserver:
- ‘largest-contentful-paint’ entries showed the LCP element was an image that loaded late due to a non-preloaded hero image.
- Fonts were swapping (FOIT/FOUT) because font loading blocked character rendering.
Fixes applied:
- Addedfor the hero image.
- Updated font loading strategy: use font-display: optional and a preload for the primary font.
Outcome: LCP improved by 40% on mobile real-user sessions.
Catching layout shifts (CLS) and attributing them
layout-shift entries let you see individual shift scores and whether a shift occurred after user input (which shouldn’t count for CLS). Use buffered:true and remember to filter entries where hadRecentInput is true.
const clsObserver = new PerformanceObserver(list => {
  let sessionValue = 0;
  for (const entry of list.getEntries()) {
    // Ignore shifts caused by user input
    if (!entry.hadRecentInput) {
      sessionValue += entry.value; // entry.value is the shift score
    }
  }
  // Send or aggregate the session value to your telemetry
  navigator.sendBeacon(
    '/telemetry',
    JSON.stringify({ metric: 'cls', value: sessionValue })
  );
});

clsObserver.observe({ type: 'layout-shift', buffered: true });
Case study 3 - Ads and layout instability
A publisher site showed high CLS. Observations revealed large layout-shift entries coinciding with ad slots that loaded without reserved space.
Fix: set width/height or aspect-ratio on ad placeholders; lazy-load ads only after initial render; reserve space via CSS. Result: CLS dropped by 70%.
From observation to production-grade instrumentation
Collecting entries is only half the battle. Here are practical tips for safe, efficient production instrumentation:
- Sampling: send only a subset (e.g., 1%) of sessions to save bandwidth and processing.
- Batching: aggregate multiple entries and send them periodically or on visibilitychange.
- Use navigator.sendBeacon for reliability on unload.
- Limit retained data: store only metric names and numbers, avoid DOM snapshots or URLs that could contain PII.
- Use buffered: true when you need early metrics (LCP, CLS) and mark observers as short-lived.
- Avoid heavy work inside the callback. Offload to a microtask with setTimeout(…, 0) or to requestIdleCallback.
Advanced example: lightweight batched telemetry
const batch = [];
function flush() {
  if (batch.length === 0) return;
  navigator.sendBeacon('/perf', JSON.stringify(batch.splice(0)));
}

const perfObserver = new PerformanceObserver(list => {
  for (const entry of list.getEntries()) {
    batch.push({
      type: entry.entryType,
      name: entry.name,
      start: entry.startTime,
      duration: entry.duration || 0,
    });
  }
  // Schedule flush during idle time
  if (typeof requestIdleCallback === 'function') {
    requestIdleCallback(flush, { timeout: 2000 });
  } else {
    setTimeout(flush, 2000);
  }
});

perfObserver.observe({ type: 'resource', buffered: true });
perfObserver.observe({ type: 'longtask', buffered: true });
// Stop observing after a meaningful window, e.g., 30s
setTimeout(() => perfObserver.disconnect(), 30000);
Browser support and fallbacks
PerformanceObserver is widely supported in modern browsers, but support for specific entry types varies. For older browsers or missing entry types:
- Use PerformanceTiming / Navigation Timing as a fallback for navigation-related metrics.
- Synthetic lab tests (Lighthouse, PageSpeed) can fill gaps but won’t replace real-user telemetry.
Check current compatibility: https://developer.mozilla.org/en-US/docs/Web/API/PerformanceObserver#browser_compatibility
Privacy and security reminders
Collect only aggregated numeric signals. Never collect HTML, text nodes, or full URLs that may contain sensitive tokens. Use secure endpoints, and disclose telemetry in your privacy policy.
Wrap-up: make the data actionable
Observing performance is about turning signals into prioritized action: spot the heavy script, measure improvements after a change, and verify that fixes actually reach real users. PerformanceObserver gives you fine-grained, real-time signals - a direct line from the browser to your understanding of user experience.
Start small: observe longtask and LCP, send a sampled heartbeat, then iterate. Keep observers short-lived, batch your reports, and avoid capturing sensitive data.
If you set up this feedback loop, you won’t be guessing where your app feels slow anymore. You’ll know - precisely when, how, and for whom - and you’ll be empowered to fix what’s hurting your users.
Further reading
- MDN: PerformanceObserver - https://developer.mozilla.org/en-US/docs/Web/API/PerformanceObserver
- web.dev: PerformanceObserver guide - https://web.dev/performanceobserver/
- web.dev: Largest Contentful Paint - https://web.dev/largest-contentful-paint/
- web.dev: Cumulative Layout Shift - https://web.dev/cls/
- web.dev: Long Tasks - https://web.dev/long-tasks/
- web.dev: Interaction to Next Paint (INP) - https://web.dev/inp/
