· tips · 5 min read
Debugging with Flair: Using Console Groups and Timers for Enhanced Clarity
Learn to organize and time your logs using console.group and console.time. This guide shows practical patterns, examples, and helper utilities to make debugging clearer - and even a bit fun.

Outcome first: by the end of this article you’ll be able to turn chaotic console output into structured, readable sections and measure function runtimes precisely - all with a few small API calls. You’ll debug faster. You’ll spot bottlenecks quicker. And your console will finally look like it knows what it’s doing.
Why groups and timers?
When you open the console during debugging, you want one thing: clarity. Fast. Clear.
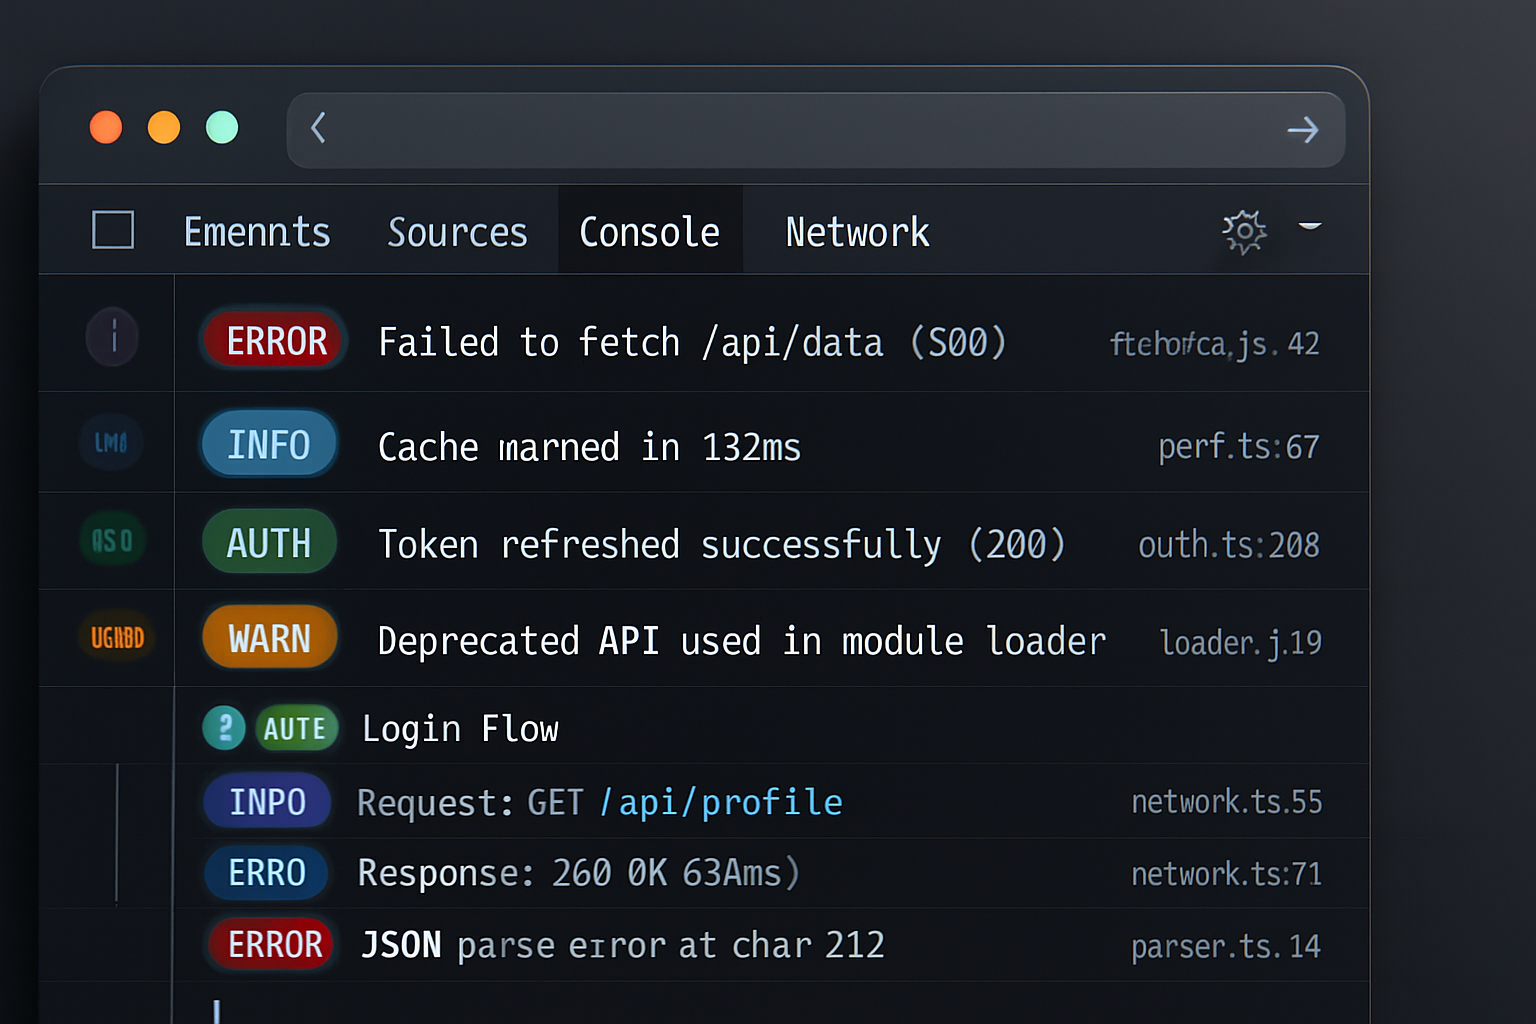
Plain logs are noisy. They bury context and timing. Two small browser/Node APIs fix a lot of that pain: console.group() (and its relatives) for structure, and console.time() for timing. Use them together and your logs will read like a well-formatted report.
Here’s what you’ll learn:
- How to use
console.group,console.groupCollapsed, andconsole.groupEndto create structured logs - How to use
console.time,console.timeLog, andconsole.timeEndto measure synchronous and asynchronous work - Practical helper utilities and patterns to keep code clean
- Cross-environment notes and gotchas
Quick reference (what you’ll use)
- console.group(label)
- console.groupCollapsed(label)
- console.groupEnd()
- console.time(label)
- console.timeLog(label, …data)
- console.timeEnd(label)
For full descriptions see the MDN Console documentation: https://developer.mozilla.org/en-US/docs/Web/API/Console
Basic grouping: make related logs belong together
Use groups when you want to attach several log lines to a single logical unit.
console.group('Fetch user');
console.log('URL:', url);
console.log('Options:', options);
console.groupEnd();
In the browser console this will create an expandable group labeled “Fetch user”. Use console.groupCollapsed('label') if you want the group collapsed by default.
Why this matters: when you scan logs, a collapsed, labeled block reduces clutter and gives context immediately.
Timers: measure stuff in-place
Measuring runtime is simple:
console.time('parse');
parseLargeFile(data);
console.timeEnd('parse');
// parse: 45.37ms
If you want intermediate checkpoints, console.timeLog will print the current elapsed time without stopping the timer:
console.time('process');
stepA();
console.timeLog('process', 'after stepA');
stepB();
console.timeEnd('process');
// process: 12.04ms after stepA
// process: 29.98ms
Use meaningful labels. They are the key to readable timing output.
Combine groups and timers for readable profiling
Structure + timing = instant clarity. Here’s a concrete example for an HTTP request handler:
function handleRequest(req) {
  console.groupCollapsed(`Request: ${req.method} ${req.url}`);
  console.time('handler');

  console.log('Headers:', req.headers);

  doDatabaseWork(req.body)
    .then(result => {
      console.timeLog('handler', 'db done');
      processResult(result);
      console.timeEnd('handler');
      console.log('Result:', result);
      console.groupEnd();
    })
    .catch(err => {
      console.error('Handler error', err);
      console.timeEnd('handler');
      console.groupEnd();
    });
}
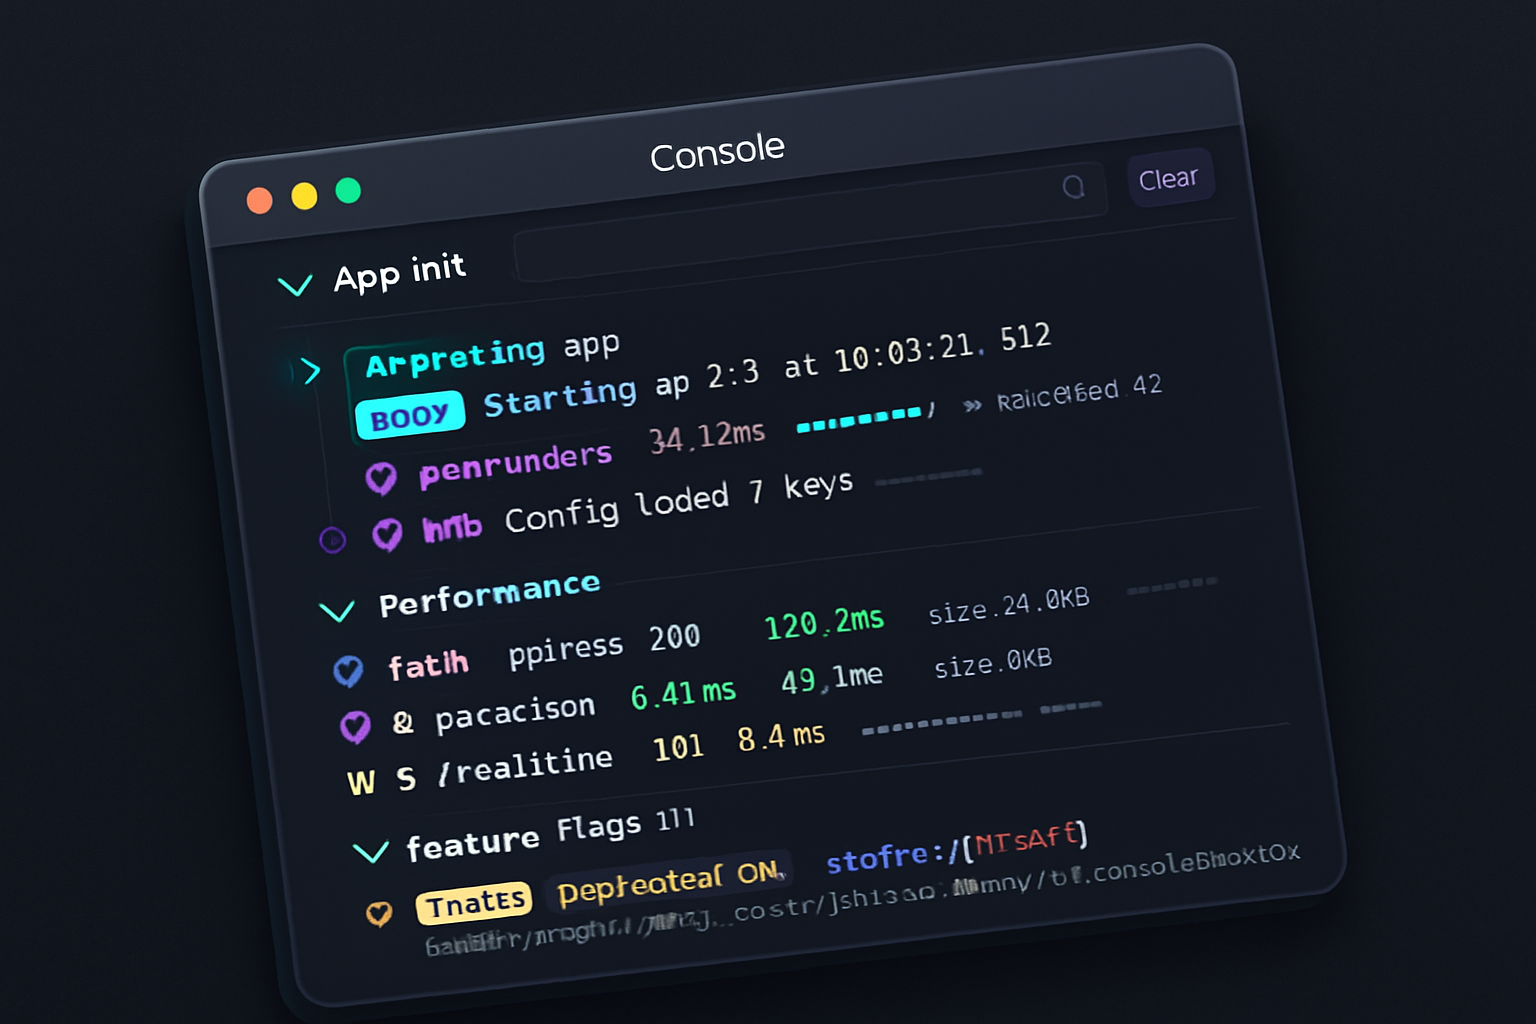
When you inspect the log, you’ll see a collapsed request block with an inline timing breakdown. You immediately know how long the handler ran and where time was spent.
Helpful pattern: scoped logging utility
If you like brevity and safety (avoid forgetting groupEnd() or timeEnd()), wrap the pattern in a helper.
function withLogContext(label, fn) {
  console.groupCollapsed(label);
  console.time(label);
  try {
    const res = fn();
    if (res && typeof res.then === 'function') {
      // Promise-aware
      return res.then(val => {
        console.timeEnd(label);
        console.groupEnd();
        return val;
      }, err => {
        console.timeEnd(label);
        console.groupEnd();
        throw err;
      });
    }
    // synchronous
    console.timeEnd(label);
    console.groupEnd();
    return res;
  } catch (err) {
    console.timeEnd(label);
    console.groupEnd();
    throw err;
  }
}

// Usage
withLogContext('heavyOperation', () => {
  doSynchronousWork();
});

// Promise version
withLogContext('asyncOp', () => fetch('/api/data'))
  .then(...)
This helper ensures that timeEnd and groupEnd are called even for async flows and exceptions. Small wrappers like this dramatically reduce accidental unclosed groups or timers.
Advanced: namespaced timers and unique IDs
Labels are strings - collisions are possible in large apps. Consider namespacing timers or using unique IDs:
const id = `task-${Math.random().toString(36).slice(2, 8)}`;
console.time(id);
// ...
console.timeEnd(id);
Or adopt a convention: moduleName:label or requestId:step.
Timing async functions elegantly
For measuring async operations, measure from start to finish by wrapping a Promise:
async function timed(name, asyncFn) {
  console.time(name);
  try {
    const result = await asyncFn();
    console.timeEnd(name);
    return result;
  } catch (err) {
    console.timeEnd(name);
    throw err;
  }
}

// Usage
await timed('loadUser', () => fetchUser(userId));
If you want intermediate logs while the async operation runs, use console.timeLog(name, 'checkpoint') inside the async function.
Styling logs (make them pop)
In the browser you can add CSS styles with the %c placeholder to make headings, warnings, or durations stand out.
console.group('%cMy Block', 'font-weight:bold; color: #0b84ff');
console.log('%cDuration:', 'color: #888', '42ms');
console.groupEnd();
Use this sparingly. Color makes important blocks pop, but too many colors become noise.
Useful companion APIs
console.table()- great for arrays/objects with many rows.console.trace()- prints a stack trace where the log was called.console.clear()- reset the console when dumping a fresh report.
Use them alongside groups and timers to create a mini-report that reads well.
Cross-environment notes and gotchas
- Browser consoles (Chrome, Firefox, Edge) support groups and timers and show nicely formatted output.
- Node.js supports these APIs too; output is textual instead of visually nested blocks in some terminals. Still useful for logs and CI recordings.
- Mismatched labels: calling
console.timeEnd('x')without a priorconsole.time('x')will log a warning in many environments. - Forgetting to call
groupEnd()can lead to confusing indentation in the console. Wrappers or try/finally help avoid that.
Reference: the console API docs on MDN: https://developer.mozilla.org/en-US/docs/Web/API/Console
Small checklist for readable logging
- Use concise, descriptive labels (module:action or requestId:step).
- Collapse noisy groups by default (
groupCollapsed) and expand when debugging deeper. - Use timers for operations that feel slow; start with coarse timers, refine as needed.
- Use
timeLogfor checkpoints inside long-running processes. - Wrap logic to ensure
groupEnd()andtimeEnd()are always called.
Real-world example: comparing aggregation strategies
Suppose you’re experimenting with two aggregation strategies and you want a side-by-side report:
console.group('Aggregation benchmark');
console.time('strategyA');
const a = runStrategyA(data);
console.timeEnd('strategyA');

console.time('strategyB');
const b = runStrategyB(data);
console.timeEnd('strategyB');

console.log('Strategy A result size:', a.length);
console.log('Strategy B result size:', b.length);
console.groupEnd();
The console clearly shows which strategy is faster and prints result sizes right under that labeled block.
Final words - make your logs tell a story
Plain logs are noise. Grouped, timed logs are a narrative. They show context, sequence, and cost. They let you skim for the important parts and dive into details when you need them. Use console.group* to create readable chapters. Use console.time* to measure the action inside. Wrap the pattern in helpers so you never forget to close your story.
Do this and your console will stop being a swamp of messages and start being a map. The path to faster debugging starts with structure - and timers give you the speedometer.


